
- Видео 11
- Просмотров 1 060 823
Christoph Scherber
Германия
Добавлен 27 сен 2010
In this channel, you can find lectures and videos on statistical data analysis, and an introduction to various aspects of the statistical software package "R".
____________________________
IMPRINT
Christoph Scherber
48159 Münster, Germany
contact: see below
IMPRESSUM
Christoph Scherber
48159 Münster
Kontaktdaten siehe unten
____________________________
____________________________
IMPRINT
Christoph Scherber
48159 Münster, Germany
contact: see below
IMPRESSUM
Christoph Scherber
48159 Münster
Kontaktdaten siehe unten
____________________________
Mixed effects models with R
A video showing basic usage of the "lme" command (nlme library) in R. In particular, I compare output from the lm() command with that from a call to lme().
Here comes the R code used in this tutorial:
library (nlme)
data(Oats)
str(Oats)
plot(Oats)
model1=lm(yield~Variety*nitro,data=Oats)
summary(model1)
model2=lme(yield~Variety*nitro,data=Oats,random=~1|Block/Variety)
summary(model2)
coef(model1)
coef(model2)
plot(ranef(model2))
plot(model2)
Here comes the R code used in this tutorial:
library (nlme)
data(Oats)
str(Oats)
plot(Oats)
model1=lm(yield~Variety*nitro,data=Oats)
summary(model1)
model2=lme(yield~Variety*nitro,data=Oats,random=~1|Block/Variety)
summary(model2)
coef(model1)
coef(model2)
plot(ranef(model2))
plot(model2)
Просмотров: 190 941
Видео


Chords of steam
Просмотров 1,2 тыс.10 лет назад
A four-track piece by C.S., played with a midi keyboard recorded in Samplitude Music Studio.

Statistics with R (4) - Understanding contrasts and the model summary in R
Просмотров 40 тыс.10 лет назад
In this video, I use an ANOVA-type dataset (Orchard sprays) to illustrate the use of contrasts in R and the interpretation of coefficients in summary tables of linear models. The R code used is as follows: data(OrchardSprays) str(OrchardSprays) plot(decrease~treatment,data=OrchardSprays) model1=lm(decrease~treatment,data=OrchardSprays) summary(model1) library(nlme) model2=gls(decrease~treatment...

Statistics with R (3) - Generalized, linear, and generalized least squares models (LM, GLM, GLS)
Просмотров 129 тыс.10 лет назад
In this video, I show how how to implement linear models, generalized linear models and generalized least squares models in R. Using the "airquality" dataset, I show how to fit and interpret the models. The core of the session is the interpretation of partial slope coefficients in Poisson generalized linear models. Finally, I give an outlook on generalized additive models which will be covered ...

Statistics with R (2) - Multiple regression with an interaction term
Просмотров 121 тыс.10 лет назад
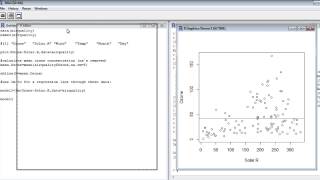
In this video, I show how to use R to fit a multiple regression model including a two-way interaction term. I show how to produce fitted lines when there is an interaction between two continuous (!) variables. The code used in this video is: data(airquality) names(airquality) #[1] -Ozone- -Solar.R- -Wind- -Temp- -Month- -Day- # Produce plots for some explanatory variables plot(Ozone~Solar.R,air...
Statistics with R (1) - Linear regression
Просмотров 438 тыс.10 лет назад
In this video, I show how to use R to fit a linear regression model using the lm() command. I also introduce how to plot the regression line and the overall arithmetic mean of the response variable, and I briefly explain the use of diagnostic plots to inspect the residuals. Basic features of the R interface (script window, console window) are introduced. The R code used in this video is: data(a...

Statistics 05 Linear statistical models in matrix form
Просмотров 13 тыс.10 лет назад
In this lecture, I show the general way in which linear statistical models may be represented in matrix form. Using a simple example with two explanatory variables, I show how the model matrix is constructed.

Statistics 04: Types of response variables
Просмотров 12 тыс.10 лет назад
In this lecture, I cover the types of response variables, and the types of parametric statistical models that may be employed to analyze such data. In particular, I show how generalized linear models with Gaussian, Poisson, Binomial or Gamma errors can be used for data analysis.

Statistics 03: Types of statistical models
Просмотров 77 тыс.10 лет назад
In this lecture, I show which types of statistical models should be used when; the most important decision concerns the explanatory variables: When these are continuous, the analysis type will be regression; however, when these are factors, then we will conduct an analysis of variance. Overall, I show that both analyses are special examples of what is called a Linear Statistical Model. I briefl...
Statistics 02: Response and Explanatory Variables
Просмотров 32 тыс.10 лет назад
In this lecture, I show how to get started with a statistical data analysis. The most important thing to decide is: "What are the response and the explanatory variables?" For further material, visit wwwuser.gwdg.de/~cscherb1/statistics.html
Statistics 01: Introduction to statistics
Просмотров 7 тыс.10 лет назад
This is the first video of a lecture series on statistics that I´m currently recording. It will give you a short definition of what statistics is all about.
This was a really good video
Thankyou for a clear explanation.
10:00
Thank you very much for this explanation, You are brilliant and very good mentor
Great job thanks
super hilfreiche videos!! warum muss die reihenfolge der pararmeter auch anders sein im englischen :((( hätte mir so viel zeit und frust sparen können wenn ich das früher gewusste hätte! (ich hoffe, dass es so ist und ich das jetzt durchschaut habe haha)
Very good presentation. Thanks
Very effective approach to understand for beginners, Thank You! From 🇧🇩
Thanks, A great Teacher
Wow something wired just happend I swear I was trying to listen to your lecture about this topic previously but wasn't quite able to grasp it, now its like very clear to me. Thank you for your work, I think thanks to you I am starting to see this statistical modeling picture now.
short and sweet
Me after the 5th video... Already feeling like a statistics guru
great explanation... Thanks
An excellent lesson thank you Christoph
thank you Christoph so much
Awesome job man! This is good stuff, thank you for this!!
Great content.
Hello, I am French and it is a true pleasure to follow such clear explanation on this subject. Thank you a hundred times ! And congratulations. You present very well
There are many great researchers and their works on line. Their researches have been helpful. kudos to everyone.
Now is the analysis is trending, maybe you should start posting again
Hi Christoph. Thank you very much for your very clear tutorial. I particularly like your combined use of code and handwriting to demonstrate the methods! I am relatively new to R and am currently using categorical variables (more than 2 levels in each) in a meta-regression model (using the robu() function in R to implement robust variance estimation), to investigate their individual effects on the combined effect size generated by the meta-analysis. I am using an existing article as a guide (Shields et al.,2017 - The Effects of Acute Stress on Episodic Memory: A Meta-Analysis and Integrative Review), where the authors seem to have used contrast-coding for a comparison between each level/category and the grand mean (rather than comparing between levels or with a default reference). Sum (or deviant) coding appears to achieve this; however, I am always unable to report the coefficient and associated p-level for the 'dummy/reference' level that gets dropped due to k-1 columns. I wondered if you might know a way around this please? Maybe by creating a bespoke contrast? I will keep hunting, but yet to find a solution! Many thanks, Lucy.
Could you explain how to get the method of moments estimator for the compound poisson process?
Simple! Very good for people like me (1º stepts on R). Thank you Christoph!
Nice explanation..Christoph.. Can you suggest the use of mixed linear models for a unbalanced data.. varieties of three different maturities like early, medium and late that are variable across the years (few being common across years)? How to proceed in such case? Any suggestions please
hello, thank you for this video. i have a question... when use a particular distribuition on the model? like poisson or gama?
Dear Sir, Greetings. I am Rabiul from Bangladesh. I am doing my PhD, I have done my analysis on the basis of your video. I have 2 treatments (open and bagged pollination) and I have 4 sites as replication (edge and centre) and 4 locations. I need the value of (df, f, and p) of seeds/pods, 1000 seed weight and plant yield. But I am not able to understand it. Would you please help me. Kind regards, Rabiul
what about beta2??
For proportions data, can we use logistic regression??
Such a wonderful presentation 😊😊
Sorry, I believe your interpretations are a bit... misleading. At 16:33, you write that "In a glm, an individual slope gives an estimate of the multiplicative change in the response variable.... ". This is not always the case. This is the case for the Poisson distribution because the default link is a log link. But, you could easily run a glm with a Gaussian distribution and identity link, which would have an additive interpretation. Further, it is best practices to indicate your link, even when the default is intended (learned that the hard way :) ).
This has given me problems for years, this is super helpful.
very helpful and clear style! would be good to have a followup video about how to visualize the data with this sort of model.
Hi, this video is so good and useful for me, I have a question, in the result of this model on my data , residual plot shows is not fitt( the distribution of oats is not looking like the star in the sky), who do I improve it? is there any reference? so thanks mahnaz
Thanks Chistoph for the great explanation. 1. In this model how can we check the accuracy of the model when we have test data with us. 2. Can we apply other non linear , tree based and other ensemble models too
You are very good in explanation. Everything is clear. The speed is convenient and the content well-addressed. Thank you very much!
THX Chris, Gr8 video :)
perfect... thanx
thanks a lot for your time and clear explanation is was priceless, I hope you can share more videos :) I'm looking forward to GLM part 2
Are you able to make the 6 plots because the database is structured in such a way that R intuitively knows that which variables are nested? Can a flat dataframe give you this as well?
Muchas gracias por el video. Me fue de mucha utilidad.
A very good presentation. I loved it :)
What hell do you do next? How come nobody ever tells you how to interpret the models?
Thank you very much !
Hey Christoph, is there any hope for a next video?
Many thanks for your invaluable information and explanation about the regression modeling. Could you please provide a bit more information for us. Best Regards
A quite helpfull video.
I wish I'd seen this video last month. Better late than never. Subscribed!
Danke sehr. Es war sehr Hilfsreich....
Thank you. I had no success learning R and have tried for months. I stumbled on to your video and I learn to run names after I load a data set. How simple. Now I am off and running.
How can you tell that the relationship is not linear from looking at the plot?